


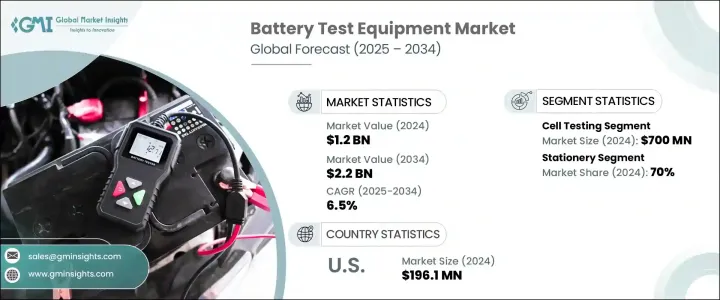
세계의 배터리 시험 장비 시장 규모는 2024년에 12억 달러에 달하며, 전동 모빌리티의 수요 증가, 재생에너지 인프라의 진보, 스마트 전자 디바이스의 성장에 의해 촉진되어 6.5%의 CAGR로 성장하며, 2034년에는 22억 달러에 달할 것으로 예측됩니다.
배터리 시스템이 점점 더 복잡해지고 고성능화됨에 따라 제조업체들은 배터리의 내구성, 정확성 및 국제 안전 표준 준수를 보장하는 테스트 툴에 대한 관심이 높아지고 있습니다. 배터리 건전성, 수명주기 최적화, 예측 진단에 대한 관심이 높아짐에 따라 테스트 장비는 업계 전반에 걸쳐 필수적인 요소로 자리 잡고 있습니다. 자동화, 데이터 분석, 클라우드 플랫폼의 통합도 전통적인 테스트 워크플로우를 변화시키고 있습니다.
이러한 지능형 시스템은 실시간 모니터링, 고급 데이터 로깅, 오류 감지를 통해 제조업체에 보다 신속하고 정확한 인사이트를 제공합니다. 새로운 배터리 화학 물질과 아키텍처가 등장함에 따라 운송, 스토리지, 전자제품 등의 분야에서 제품의 신뢰성을 유지하기 위해 유연하고 확장 가능하며 스마트한 테스트 솔루션의 필요성이 점점 더 커지고 있습니다. 이러한 최신 시스템은 진단의 정확성을 향상시킬 뿐만 아니라, 테스트 사이클 시간을 단축하고 혁신적인 배터리 기술 시장 출시 시간을 단축합니다. 또한 다양한 셀 형태와 구성에 대응할 수 있으므로 빠르게 변화하는 에너지 환경에서 항상 적합한 제품으로 남을 수 있습니다.
| 시장 범위 | |
|---|---|
| 시작연도 | 2024년 |
| 예측 기간 | 2025-2034년 |
| 당초 시장 규모 | 12억 달러 |
| 시장 규모 예측 | 22억 달러 |
| CAGR | 6.5% |
기능 부문 중 셀 레벨 테스트는 2024년 7억 달러 시장을 창출하며 우위를 차지할 것으로 예측됩니다. 이는 배터리 모듈이나 팩으로 조립하기 전에 에너지 용량, 내부 저항, 전압의 일관성과 관련된 문제를 감지하기 위해 개별 셀을 자세히 분석해야 하기 때문입니다. 이러한 기초적인 평가는 전체 시스템의 고장을 방지하고 운영 효율을 향상시키는 데 매우 중요한 역할을 합니다. 배터리 기술의 급속한 발전과 함께 셀 테스트는 제품의 수명과 안전 성능을 보장하는 데 있으며, 그 어느 때보다 중요해졌습니다.
제품 유형별로는 고정형 테스트 시스템이 2024년 시장의 70%를 차지하며 가장 큰 비중을 차지할 것으로 예측됩니다. 뛰어난 정확도, 더 긴 테스트 용량, 복잡한 성능 평가를 관리할 수 있는 능력으로 인해 대규모 에너지 저장 및 대형 배터리 유닛을 포함한 용도에 이상적입니다. 통제된 조건에서 종합적인 분석이 필요하므로 고성능 에너지 솔루션 제공에 주력하는 개발자, 연구개발자 및 배터리 제조업체에게 고정형 장비는 계속해서 선호되는 선택이 되고 있습니다.
미국 배터리 테스트 장비의 2024년 시장 규모는 1억 9,610만 달러로 2034년까지 연평균 복합 성장률(CAGR) 6.8%를 보일 것으로 예측됩니다. 지속적인 기술 혁신, 청정 에너지 분야의 확대, 배터리 생산 및 테스트 인프라에 대한 투자 증가가 그 요인입니다. 또한 정부의 지원 정책과 전기 모빌리티의 급속한 보급은 이 지역 전체에서 첨단 배터리 테스트 기술에 대한 수요를 가속화하고 있습니다.
Chroma ATE, Arbin, NH Research, Midtronics, Neware Technology Limited 등의 기업은 시장에서의 입지를 강화하기 위해 제품 혁신, 세계 확장 및 협업에 중점을 둔 전략적 구상을 추진하고 있습니다. 테스트 정확도를 높이고 진화하는 배터리 화학을 지원하기 위해 많은 기업이 R&D에 투자하고 있으며, Maccor 및 Bitrode와 같은 기업은 다양한 고객 요구에 대응할 수 있는 확장 가능한 모듈형 테스트 플랫폼을 출시하고 있습니다. 또한 여러 기업이 AI 기반 분석과 클라우드 연결을 통합하여 지능형 진단 툴을 제공합니다. 연구 기관 및 시장 역학과의 제휴는 맞춤형 서비스 제공과 함께 이들 기업이 역동적이고 혁신이 주도하는 시장에서 경쟁 우위를 확보할 수 있도록 돕고 있습니다.
The Global Battery Test Equipment Market was valued at USD 1.2 billion in 2024 and is estimated to grow at a CAGR of 6.5% to reach USD 2.2 billion by 2034, driven by the rising demand for electric mobility, advancements in renewable energy infrastructure, and growth in smart electronic devices. As battery systems become more complex and performance-intensive, manufacturers are placing higher emphasis on testing tools that ensure battery durability, accuracy, and compliance with international safety standards. This rising focus on battery health, lifecycle optimization, and predictive diagnostics has made test equipment essential across industries. The integration of automation, data analytics, and cloud platforms is also transforming traditional testing workflows.

These intelligent systems allow for real-time monitoring, advanced data logging, and error detection, providing manufacturers with faster, more precise insights. As new battery chemistries and architectures emerge, the need for flexible, scalable, and smart testing solutions becomes increasingly critical in maintaining product reliability across sectors such as transportation, storage, and electronics. These modern systems not only improve the accuracy of diagnostics but also reduce testing cycle times, enabling quicker time-to-market for innovative battery technologies. Their adaptability to a wide range of cell formats and configurations ensures they remain relevant in a rapidly evolving energy landscape.
| Market Scope | |
|---|---|
| Start Year | 2024 |
| Forecast Year | 2025-2034 |
| Start Value | $1.2 Billion |
| Forecast Value | $2.2 Billion |
| CAGR | 6.5% |
Among functional segments, testing at the cell level dominated in 2024, generating USD 700 million due to the need for detailed analysis of individual cells to detect issues related to energy capacity, internal resistance, and voltage consistency before assembly into battery modules or packs. Such foundational evaluation plays a pivotal role in preventing system-wide failures and improving operational efficiency. With the rapid evolution of battery technology, cell testing has become more crucial than ever in guaranteeing product longevity and safe performance.
From a product type perspective, stationary test systems held the largest share of the market, accounting for 70% in 2024. Their superior precision, longer testing capabilities, and ability to manage complex performance evaluations have made them ideal for applications involving large-scale energy storage and heavy-duty battery units. The need for comprehensive analysis under controlled conditions continues to make stationary equipment the preferred choice for developers, researchers, and battery manufacturers focused on delivering high-performance energy solutions.
United States Battery Test Equipment Market generated USD 196.1 million in 2024 and is projected to grow at a CAGR of 6.8% through 2034, driven by continuous innovation, expansion in the clean energy sector, and increasing investments in battery production and testing infrastructure. Supportive government policies and the rapid adoption of electric mobility have also accelerated the demand for advanced battery testing technologies across the region.
To strengthen their market position, companies like Chroma ATE, Arbin, NH Research, Midtronics, and Neware Technology Limited are pursuing strategic initiatives focused on product innovation, global expansion, and collaboration. Many are investing in R&D to enhance test precision and support evolving battery chemistry. Firms such as Maccor and Bitrode are launching scalable, modular testing platforms that address diverse customer needs. Additionally, several players are integrating AI-driven analytics and cloud connectivity to offer intelligent diagnostic tools. Partnerships with research institutes and OEMs, along with customized service offerings, are also helping these companies gain competitive advantages in a dynamic, innovation-driven market.